- Market Overview
- Futures
- Options
- Custom Charts
- Spread Charts
- Market Heat Maps
- Historical Data
- Stocks
- Real-Time Markets
- Site Register
- Mobile Website
- Trading Calendar
- Futures 101
- Commodity Symbols
- Real-Time Quotes
- CME Resource Center
- Farmer's Almanac
- USDA Reports
The Saturday Spread: What the ‘Flying Spaghetti Monster’ Can Teach Us About Wall Street’s Latest Laggards

As Harvard Business School pointed out in October 2004, Wall Street analysts have historically been swayed at that time by relationships between the experts’ employers and the target enterprises. In a roundabout way, the argument essentially states that analysts aren’t necessarily the most accurate individuals — and sometimes, their advice can be way off the mark.
Subsequently, the financial publication industry has increasingly latched onto this vulnerability by providing relevant, high-quality content. To be sure, you’re still going to find people who are phoning it in, merely engaging in analytical cosplay around the latest hot stocks. However, with the emergence and proliferation of artificial intelligence, mediocrity will no longer be tolerated — if only because AI can mass produce such content at unimaginable scale.
It's at this point where panic sets in for astute finpub writers. To stay relevant (and employed), most have begun to adopt a brute-force approach of more: as in, more comps, growth trends and valuation ratios. Still, expanding the scale of narrative does nothing to address the circularity of the core assertions.
Indeed, the Flying Spaghetti Monster (FSM) cannot be proven to exist merely because you prayed to it and you claim that it helped you find your keys. Throwing more ratios and trends into an article doesn’t enhance the point being made. Similarly, praying to the FSM a hundred times does not raise the probability of its existence.
Obviously, we can dismiss stories of the FSM — or sasquatch or the tooth fairy — because they represent in-sample assertions: both the claim and the evidence to support the claim come from the same dataset. To statistically validate a hypothesis or discovery, an analyst must conduct an out-of-sample test to determine probability of causality, not just observation of correlation.
Even the much-discussed Santa Claus rally is an in-sample argument because the evidence is drawn from the same loop that generated the belief. Yes, it sounds reasonable until you bring up the FSM. If you prayed to the FSM consistently and 80% of the time you found your keys, is that confirmation of the deity’s existence?
The answer, of course, is no. You would need external validation to establish that the FSM is a candidate explanation for your fortuitous key-finding discoveries. As investors, you should also exercise the same level of skepticism — and that brings us to this week’s compelling laggards.
Starbucks (SBUX)
One of the common adages in the market is to buy the blood on the streets, with the idea being that good companies can occasionally fall under rough circumstances. Case in point is Starbucks (SBUX). On Friday, SBUX stock declined by 1.82%. For the week, it lost more than 3%, while for the year, it’s down over 6%.
From a quantitative perspective, SBUX appears balanced. In the past 10 weeks, accumulative and distributive sessions were split down the middle. However, the overall trajectory was downward. For classification, we can label this sequence as 5-5-D.
Using in-sample data (which extends from January 2019 through July 2025), the response to the 5-5-D tends to be positive, with the drift taking SBUX stock to a range between a median low of $84.35 and a median high of $88.60. Typically, the aggregate or baseline drift would be expected to carry SBUX from $84.35 to $87.47.
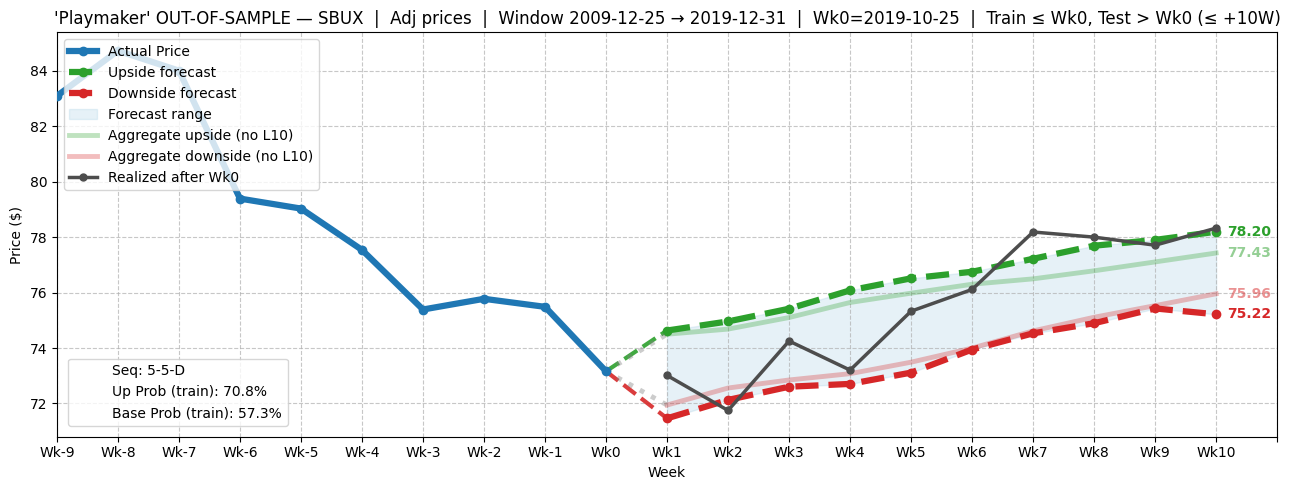
As stated earlier, the argument is fragile since it’s in-sample. For an out-of-sample test, I analyzed the 5-5-D sequence throughout the 2010s decade. This research showed that the sequence carries an upward drift, thus raising confidence in the contrarian position.
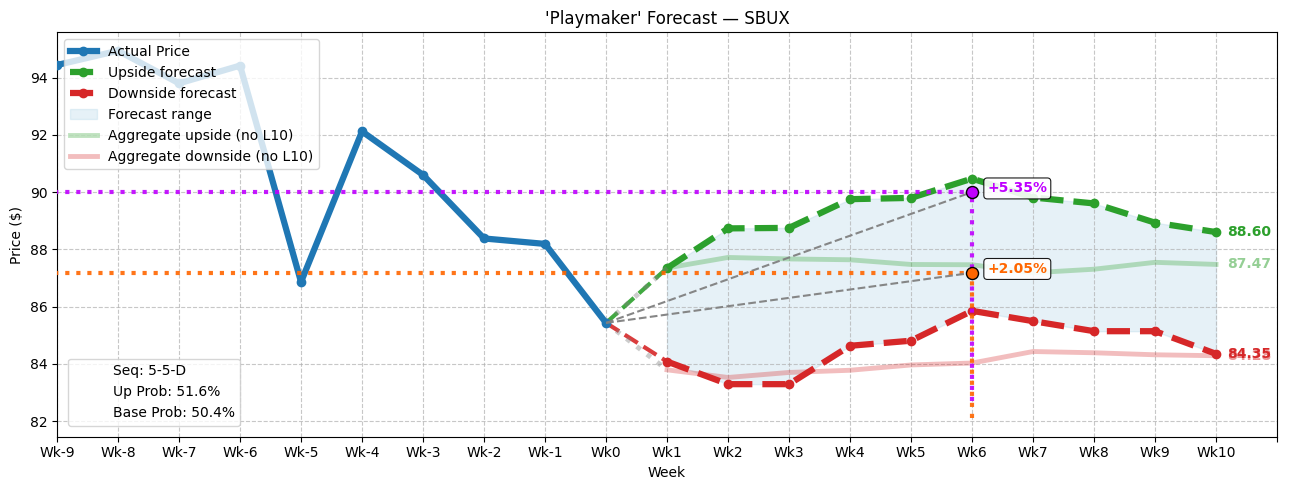
Subsequently, using data from Barchart Premier, the most sensible trade arguably is the 85/90 bull call spread expiring Oct. 17. For reaching the realistic $90 price target at expiration, the maximum payout stands at a very tempting 129.36%.
Wells Fargo (WFC)
One of the biggest banks in the world, Wells Fargo (WFC) encountered some turbulence recently. True, WFC stock is up over 12% since the start of the year, beating out the S&P 500’s 10.2% during the same frame. However, on Friday, WFC dropped 3.51%. For the week, it lost exactly 4%. Still, contrarians will want to keep this financial giant on their radar.
From a quantitative perspective, WFC stock in the past 10 weeks charted a 4-6-D sequence: four up weeks, six down weeks, with an overall downward trajectory. Ordinarily, you would anticipate that the balance of distributive sessions being greater than accumulative may indicate further pain. However, the tendency is for the 4-6-D sequence to signal a sentiment reversal.
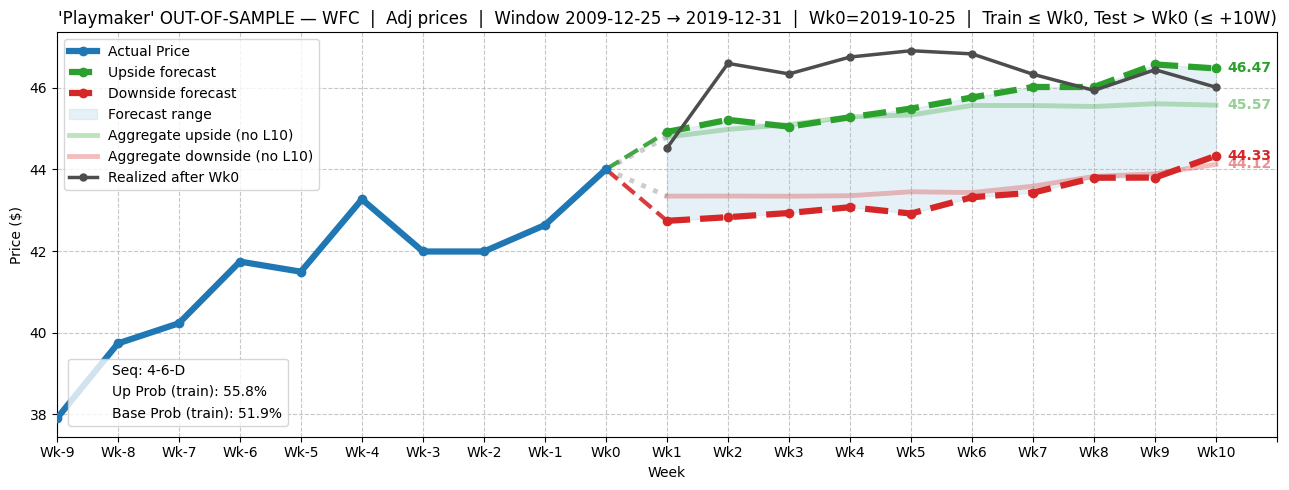
Still, the upward drift associated with the sequence is a descriptive observation of in-sample data. To determine if the signal is worth pursuing, I ran an out-of-sample test for the past decade. Even with a completely different sentiment regime, the 4-6-D sequence tends to skew WFC stock higher than what would normally be expected, assuming no special signals or mispricing.
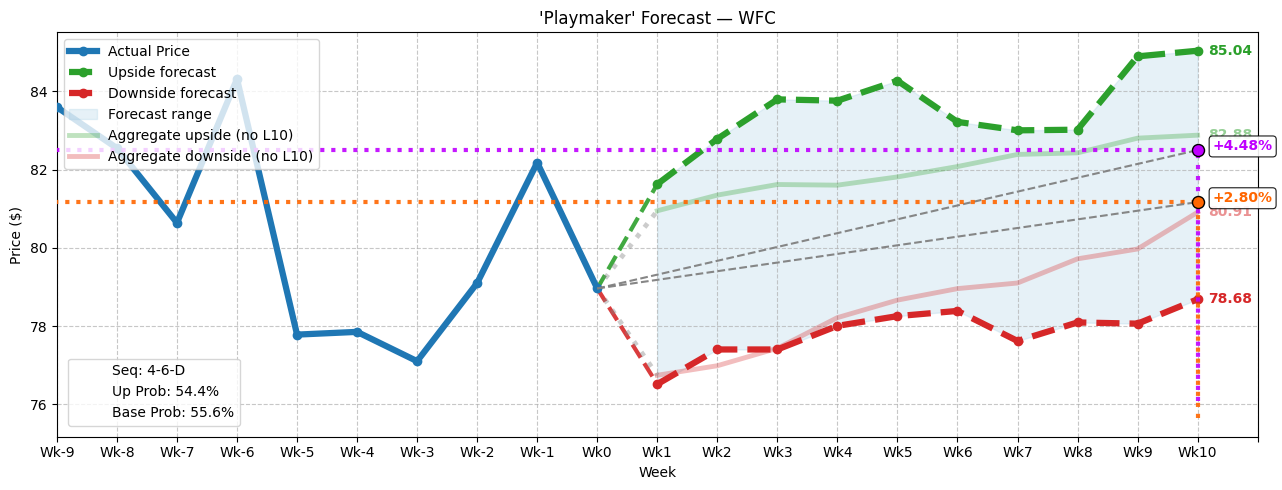
As such, I’m really intrigued by the 80.00/82.50 bull spread expiring Nov. 21 (which would correspond with an out-of-range week 11 on my chart). If WFC stock rises through the short strike price at expiration, the max payout stands at almost 114%.
Lululemon (LULU)
This is the one that you’ve all been waiting for. Following a mixed earnings report and a pessimistic forward guidance, Lululemon (LULU) tanked. In just one day heading into the weekend, LULU stock hemorrhaged almost 19%. For the year, the security is now looking at a loss exceeding 56%. Seemingly, circumstances continue to get uglier and uglier for the athletic apparel retailer.
Still, amid the turmoil, an opportunity could await. Strip away the magnitude and focus exclusively on market breadth and you have a 3-7-D sequence: three up weeks, seven down weeks, downward trajectory. Here, the balance of distributive sessions clearly outweighs accumulative. At the same time, the sequence tends to signal an uptrend, at least within the next six to seven weeks.
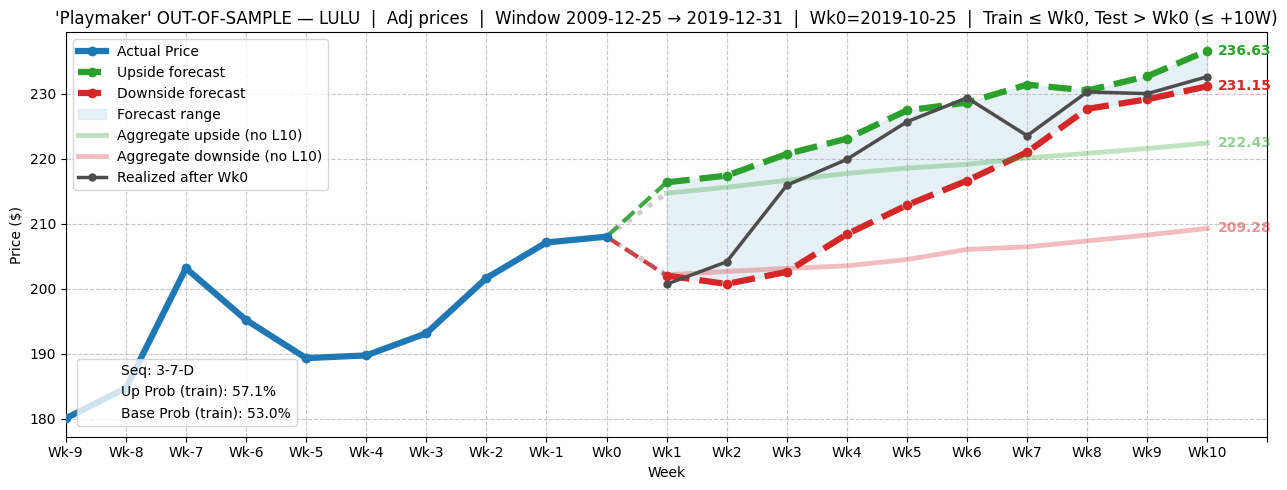
Of course, the problem centers on the in-sample nature of the argument. To determine if this is a signal worth pursuing, I ran an out-of-sample test of how the 3-7-D performed last decade. As it turned out, the signal’s contrarian nature was even more pronounced, but with the greatest lift evident between weeks five and eight.
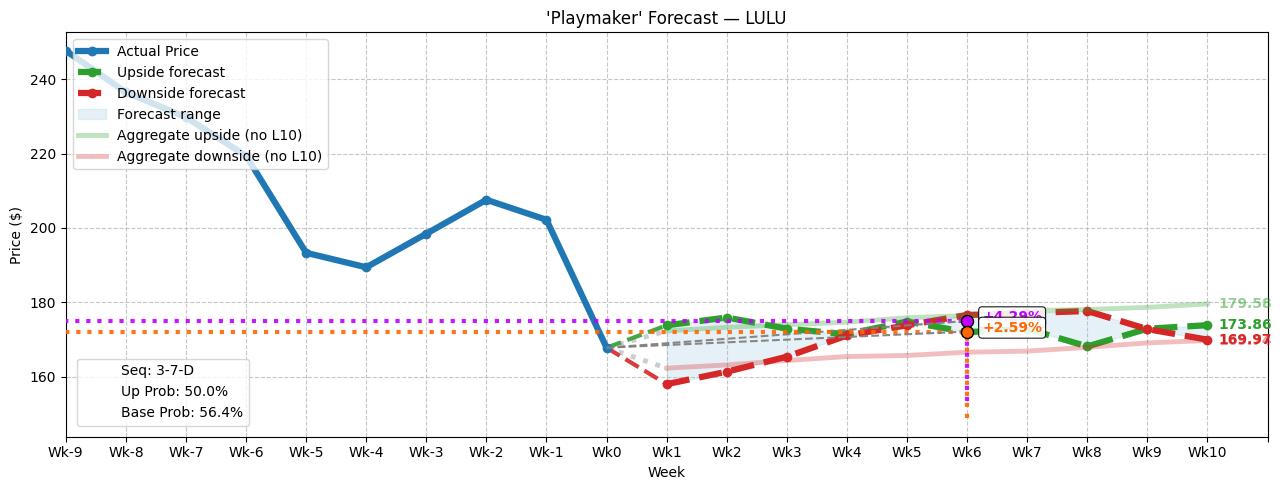
With this knowledge, aggressive traders may consider the 170/175 bull spread expiring Oct. 17. If LULU stock rises through the short strike price, the maximum profit stands at roughly 133%.
On the date of publication, Josh Enomoto did not have (either directly or indirectly) positions in any of the securities mentioned in this article. All information and data in this article is solely for informational purposes. For more information please view the Barchart Disclosure Policy here.